

1. Context
This is from the covid days, with a lot of free time on hand and the urge of making quick money, I stumbled upon various technical analysis methods - two of them stood out to me and I spent a good time learning them. They are borrowed from one of the best technical analysts and also great teachers - Manas Arora & Shubhadeep Nandy. Thanks to them, I actually learned what is Price Action Trading and explored the Volatility driven VCP method. Fast forward, with some successful trades, I built my own ‘system’ and translated into an indicator on TradingView.
Let us call that - Bull Run; predominantly a trend spotting and riding indicator on charts. It is built on couple of variables like - weekly EMA20/50 golden cross, confirmed by RSI, trend slope, and a volume-expansion filter. It generates long-only buy signals when a particular stock turns bullish and then gives a sell signal when the bull run exhausts. It keeps generating those signals - some time the signals are potent, some times the signals are noise - all in all >40% success rate.
Running it manually meant checking a watchlist of individual charts and re-deriving stop/target levels each time. The system not only needs a lot of time to identify and build positions - but also requires a good Risk- Reward (behaviour & temperament), otherwise the overall opportunity / outcome is not worth the time. So I gave up on this system when life came to normal post 2022, and also discovered true way of life - Value Investing.
Given the AI opportunity and curiosity of finding this lottery trade, now combined with power of LLMs which eliminates the need of manual work & biases, I decided to build a Systematic Trading AI App.
The goal for the app was to remove that manual steps: scan the full investable universe on a schedule, surface only the setups worth acting on, and keep a running record of what the system said versus what actually happened. Analyse the trades, take it/ ignore it and build a reiterating system which improves over time - something that I couldn’t do it manually before.
2. Architecture
This entire is setup is possible purely because of the good folks at Zerodha and their Varsity YouTube learning session. So the data source is Kite & Claude builds the analysis layer via Python, React+ Vite does a simple yet elegant UI. The setup needs to be run every day, so background scheduler thread runs inside the same process for recurring jobs (scan and refresh the universe, suggest recommendations, position worthiness and size checks etc) without needing an external Cron or task queue.
3. Universe
The universe is the combined Nifty Microcap 250 and Smallcap 250 (~500 stocks), refreshed from NSE data on end of the day basis and saved locally. This scan is then generated into Signals using my own method (proprietary system sounds fancy!)
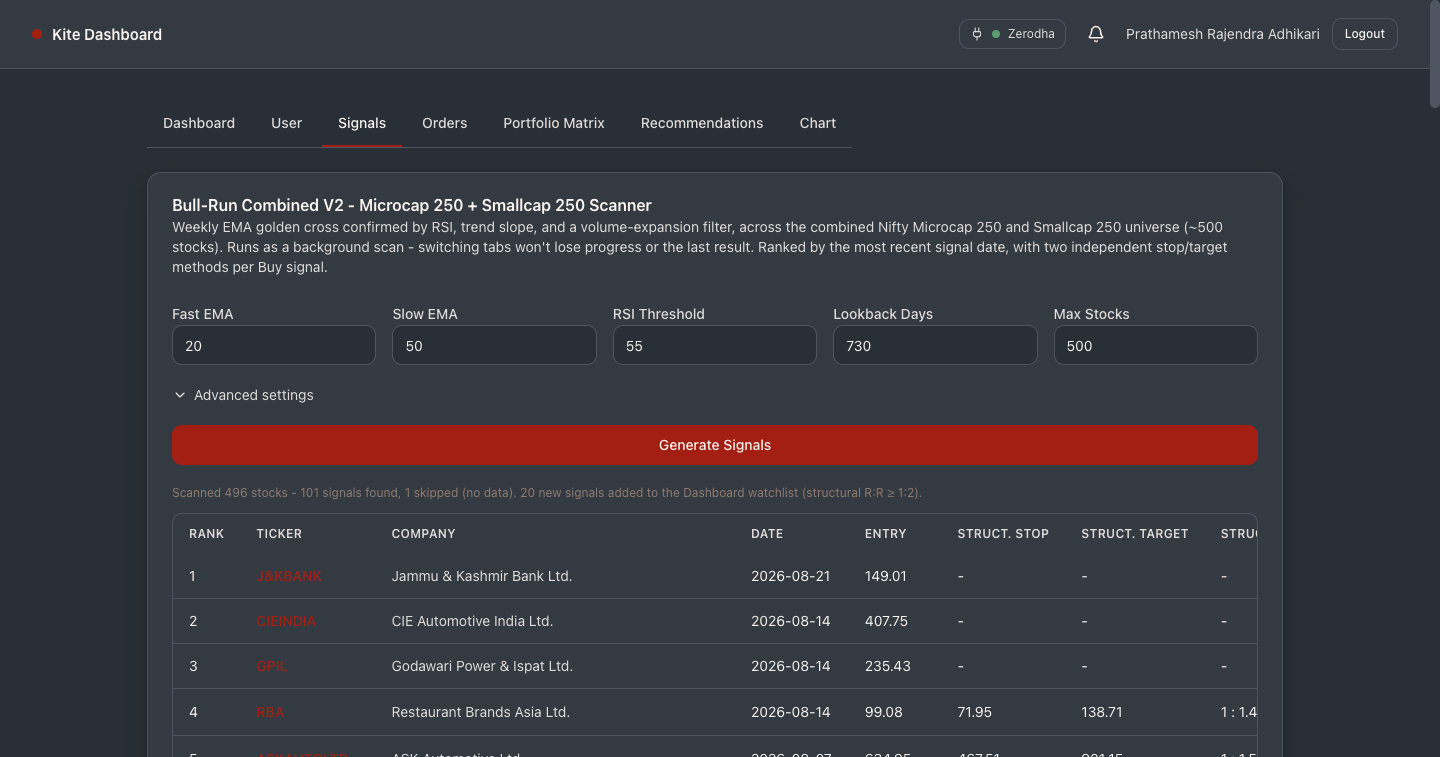
Signals tab: full 500-stock scan, run as a background job with live progress.
4. Signal
Every Buy Signal gets an independent stop loss/target readings, basis the depth of the signal - essential how deep the base was formed before the breakout happened, and the target is calculated basis the same. Buy signal is strictly post the confirmed breakout on weekly basis, for a higher probability setup; in this process a lot of stocks fizzle out which is okay - Errors of Commissions > Errors of Omissions. This by and large gives me a shortlist of ~15 stocks every time I run the scan.
5. Probability
Signals are then tagged as High / Medium / Low based on the probability of clearing 1:2 - Risk : Reward (R:R), using volatility contraction method as the input. Labels are assigned by empirical win rate ranking, not textbook expectation - a lot of back-testing went behind this (the best usage of AI). The classic volatility-contraction-pattern theory says tighter-range setups should win more; but the actual back-test data showed the widest-range tercile winning more often, so I used the latter approach to qualify a High label.
7. Dashboard
Last stage is to collect only those signals clearing structural R:R ≥ 2 and add them to the Dashboard. A stock added here is then tracked for 30 days with status transitions (active / target hit / stopped / expired). A “Refresh Prices” button is added to take the last EoD price and check target/stop has been hit or not.
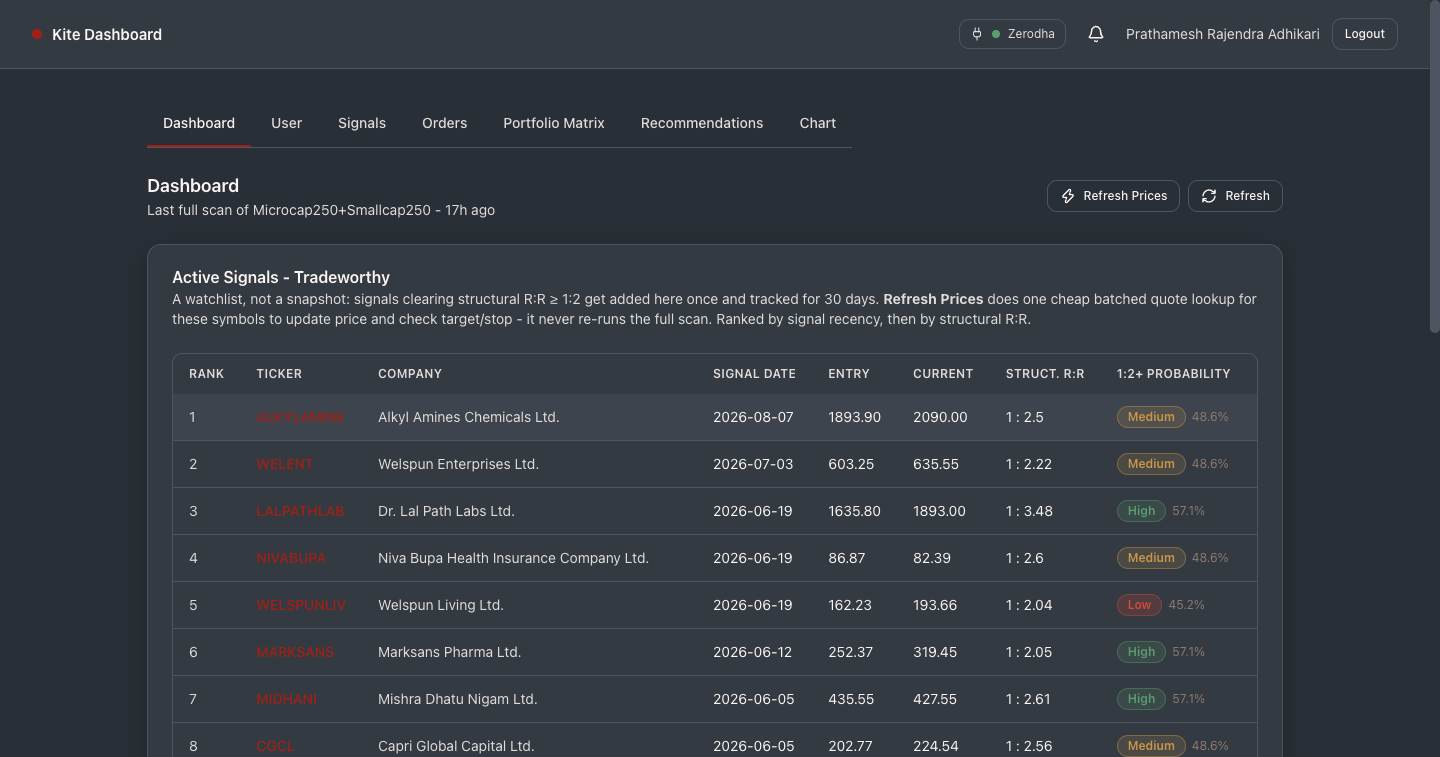
Dashboard watchlist: signals ranked by recency, then structural R:R, with the probability label
8. Chart
Anything that AI throws should have a Human In Loop check; so I added a Chart tab to see the technical analysis footprint of a particular stock - which my eyes can easily spot and relate to. This is where my domain expertise comes in of having seen 1000+ charts during the lockdown days. The Entry, Stop and Bull trigger is computed by the system and I can re-check if the R:R is worth entering for or not.
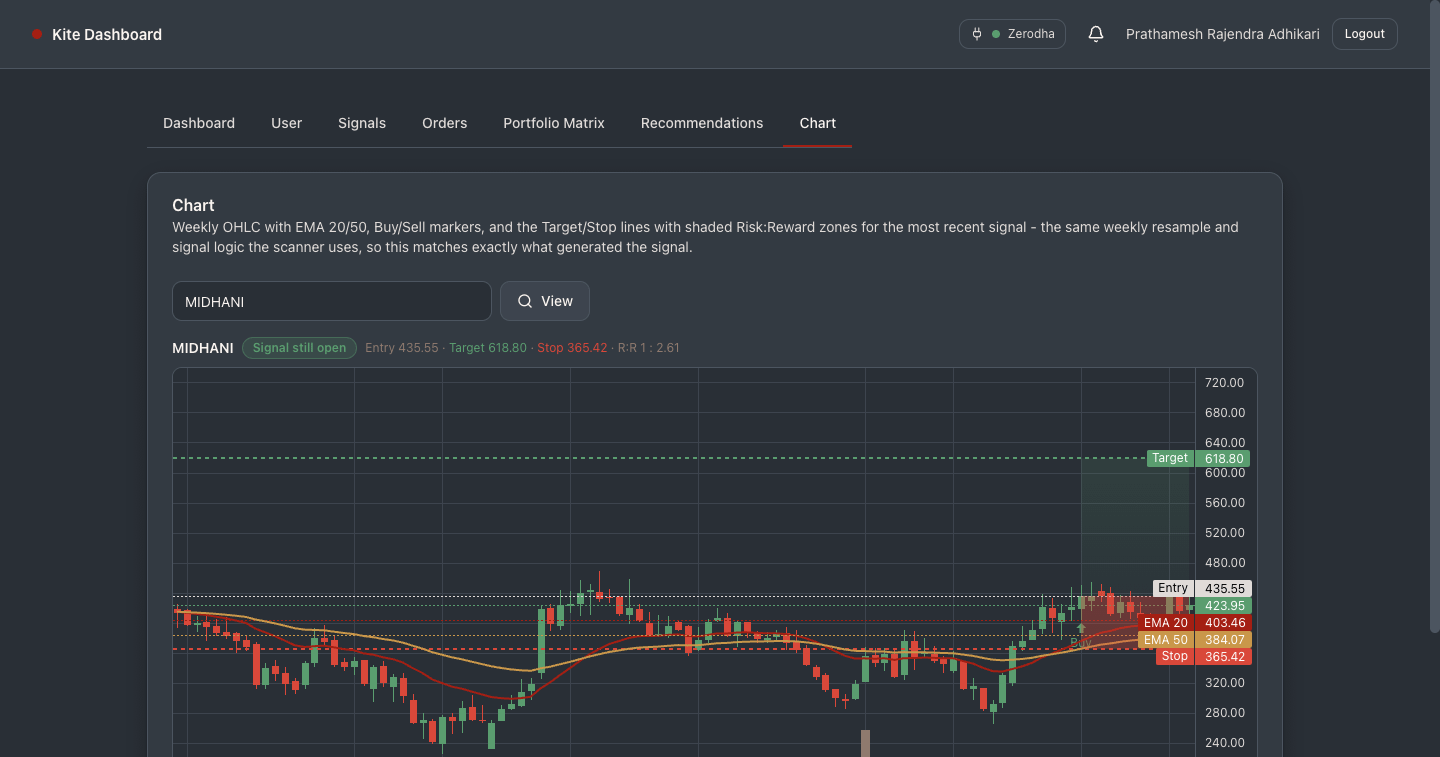
Chart tab: weekly candles, EMA20/50, and the structural target/stop lines with shaded R:R zone.
9. Portfolio level back-test
Back-testing this entire mechanism is a must. So I made a 2×2 matrix — running this method for Smallcap Vs MicroCap universe with two R:R methods System based Vs Fixed Reward (1:4) based. Used a position sizing fixed rule of not more than 25% of capital per trade, a maximum of four trade at a time, with three active and one held as cash for pyramiding the existing winners. The results are outstanding !
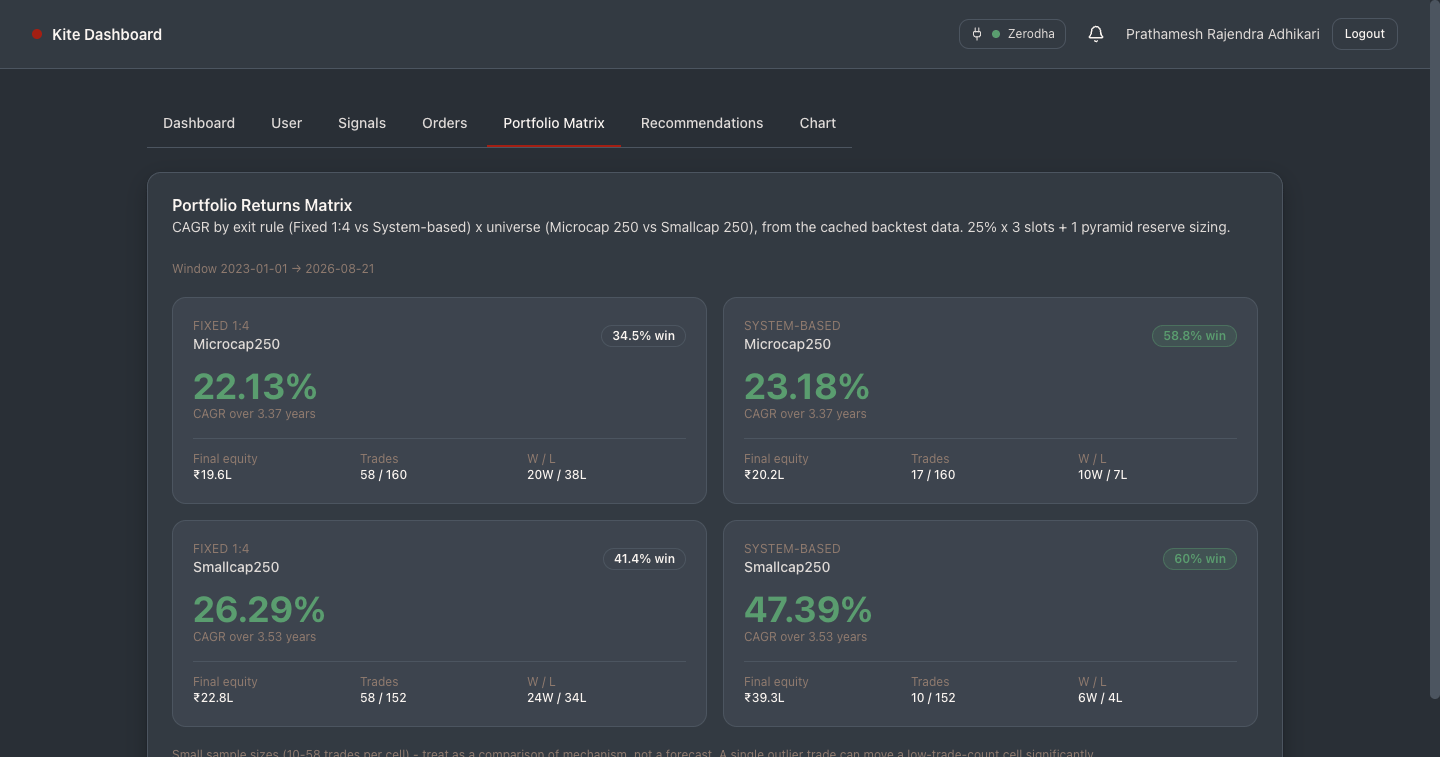
Portfolio Matrix: CAGR and win rate across the four exit-rule / universe combinations.
10. Improvement
Another AI Advantage is that the system can be improved by running recurring loops on past results and new signals - my recommendations engine runs weekly (also on demand) over the portfolio matrix, the probability calibration, and the latest scan, looking for concrete, numbers-backed observations — for example, the tool also suggests Improvements for the ‘Core System, Type of Signals, Risk: Rewards’ etc.
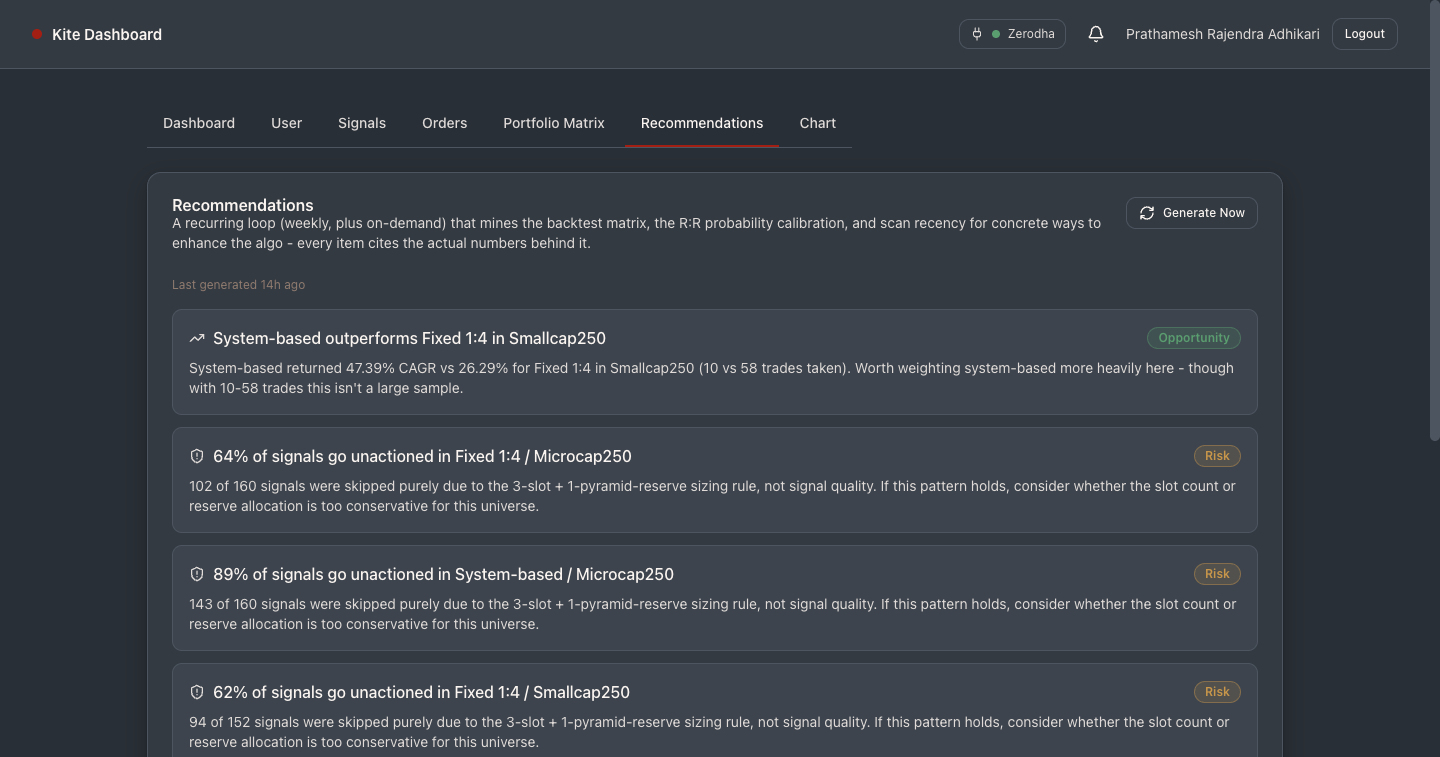
Recommendations tab: each item is generated from real back-test & calibrations
11. Alerts & Notifications
Finally one needs a constant monitoring and alerting mechanism - for the trades that have been taken. Alerts are generated for New Buy Signals and for Existing Trades - to sell or to pyramid more. Notifications are deduplicated by symbol, kind, and signal date, and appear in-app through a notification bell.
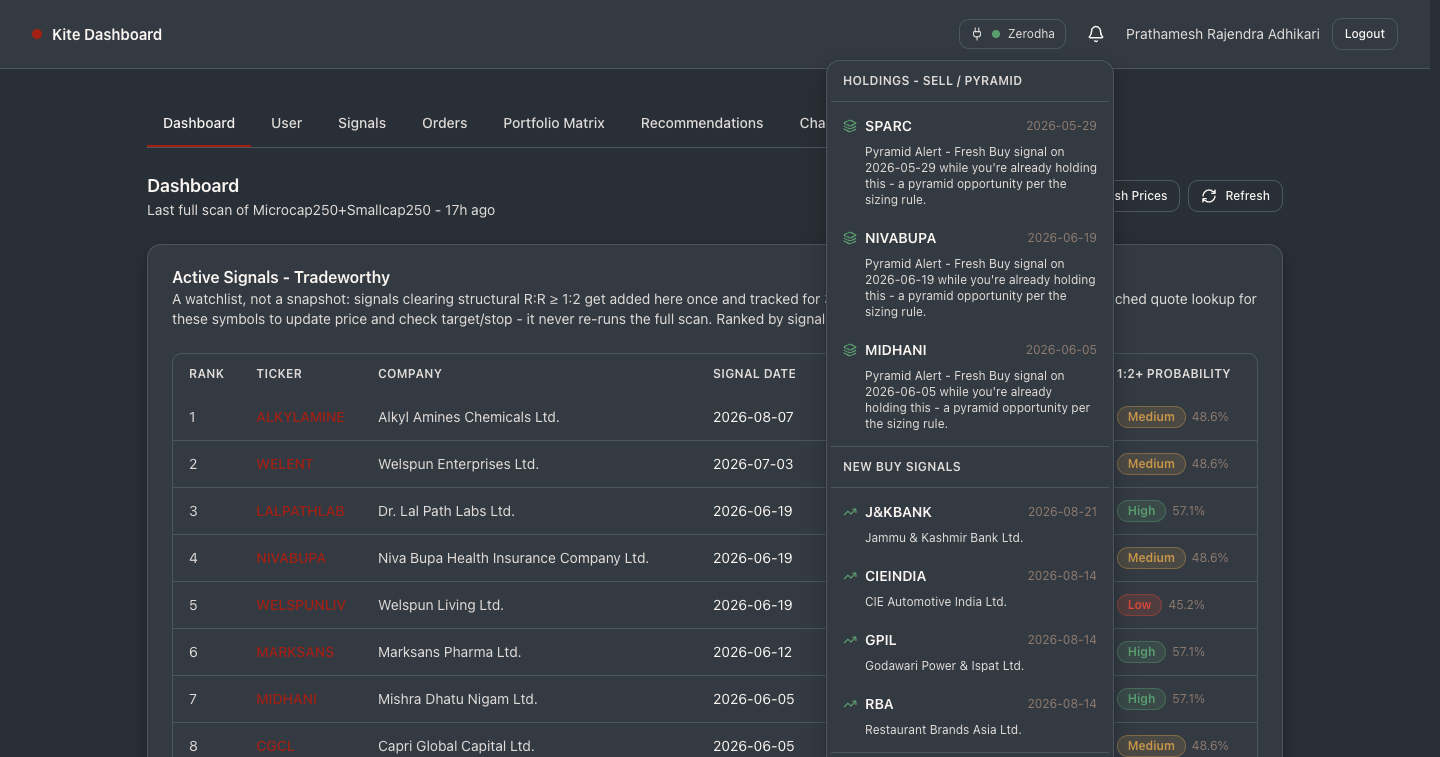
Notification bell: holdings-based Sell/Pyramid alerts shown separately from new Buy signals.
12. What’s next ?
The last and the best advantage of AI - Checking whether the probability labels still holds up. High/Medium/Low probability labels are calibrated against historical backtest data. The open question is whether they keep matching live outcomes. The plan:
Record a checkpoint for every signal at the moment it qualifies for the watchlist (entry price, assigned probability bucket).
Revisit each checkpoint at day 15 and day 30 against real subsequent price action, using the actual high/low range over that window — not just the latest close — to determine whether it realistically touched target or stop.
Roll realized outcomes up by bucket and compare realized win rate to the backtested calibration percentage for that bucket.
Flag — not auto-correct — any bucket where realized and backtested win rate diverge meaningfully once there’s enough sample size, as a prompt to manually re-run the calibration.
Hopefully all this works ! :P
Let me know if you have some feedbacks for improvements.
DISCLAIMER: I AM NOT A SEBI-REGISTERED ADVISOR OR A FINANCIAL ADVISOR. ALL THE VIEWS ARE FOR EDUCATIONAL PURPOSES. I MAY OR MAY NOT HAVE INVESTED IN THESE STOCKS. PLEASE DO YOUR DUE DILIGENCE YOURSELF. THIS IS NOT A STOCK RECOMMENDATION.
What are exact determinant or criteria. ?
Few of which I can think
Nifty 500 above 50 dma
Nifty 500 Making hh n hl
Stocks making hh n hl
Weekly rsi above 50
Tight range ie <7 percent range for more then 2 weeks
Relative volume 3 to 5 x few times in last 2 month
Stock less then 5 to 7 percent from 24 weeks high
Above 50 dma
pnadatia@gmail.com